
Report at a Glance
Key findings from the industry's first operational maturity benchmark
The Four Pillars of Operational Maturity
The Operational Maturity Scorecard measures restaurant performance across four pillars. Each respondent received a composite score from 0 to 100.

Forecasting & Planning
How accurately can we predict and plan? Measuring sales, labor, and food cost forecast variance.


People & Team
Are we setting our managers up to succeed? Tracking GM turnover and admin burden.


Execution Consistency
Are we delivering consistently for staff and guests? Tool compliance and returning customer rate.


Efficiency & Profitability
Are we turning execution into profit, consistently? Net profit margin and location-level gaps.

Where Does Your Brand Fall?
Based on composite scores, respondents fall into four maturity tiers — each representing a distinct pattern of behaviors and outcomes.
The Operational Maturity Curve
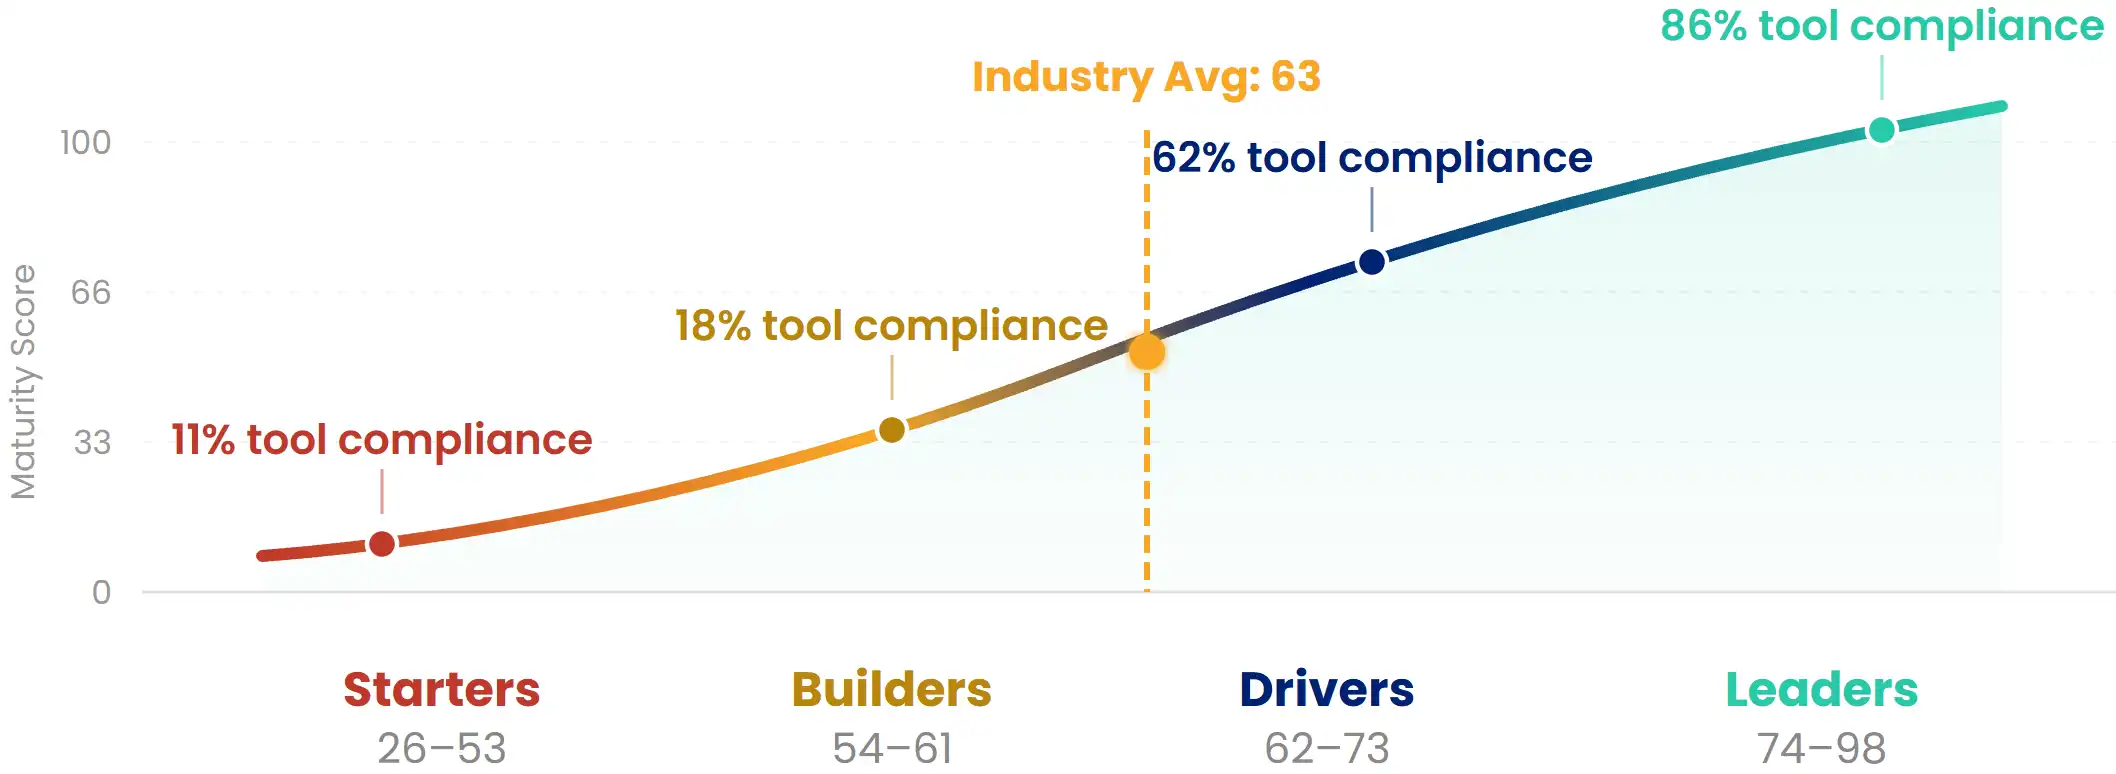
Source: Fourth / QSR Magazine Operational Maturity Survey, 2026. n=112.
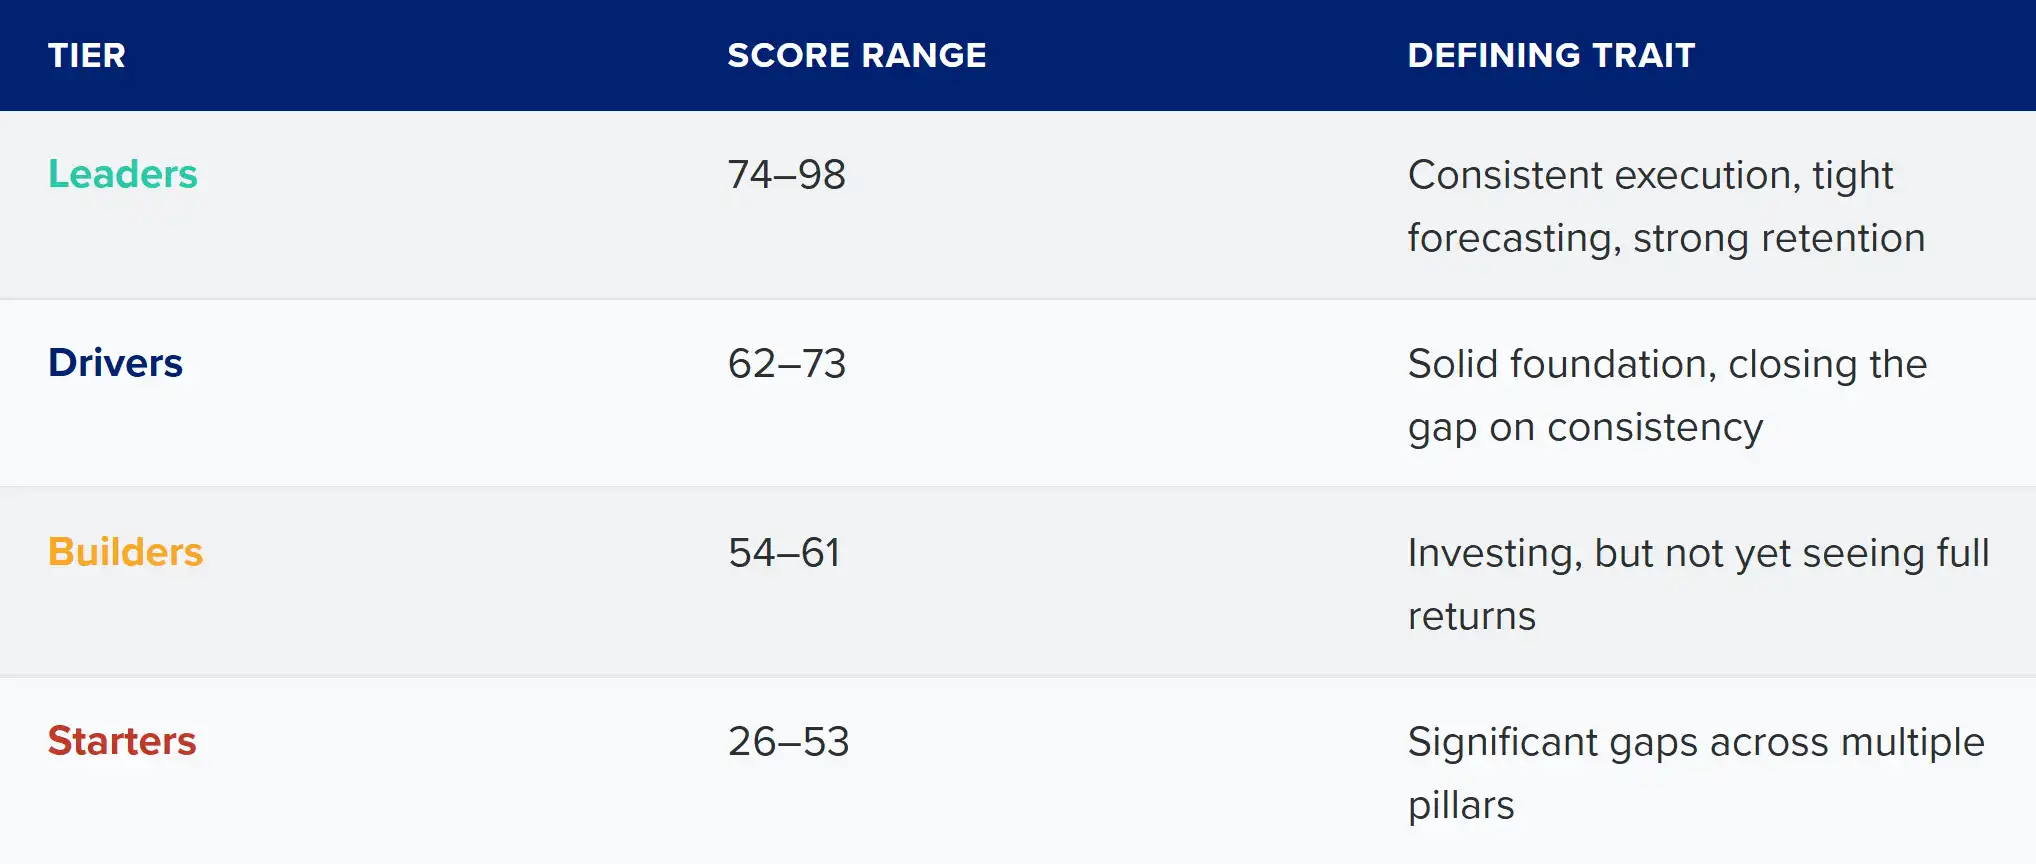
Operational Consistency: The Real Differentiator
The core finding: The biggest differentiator between the highest- and lowest-performing operators is not AI adoption, brand size, or technology spend — it is tool discipline. The most mature operators are 8x more likely to report full tool compliance across their locations.
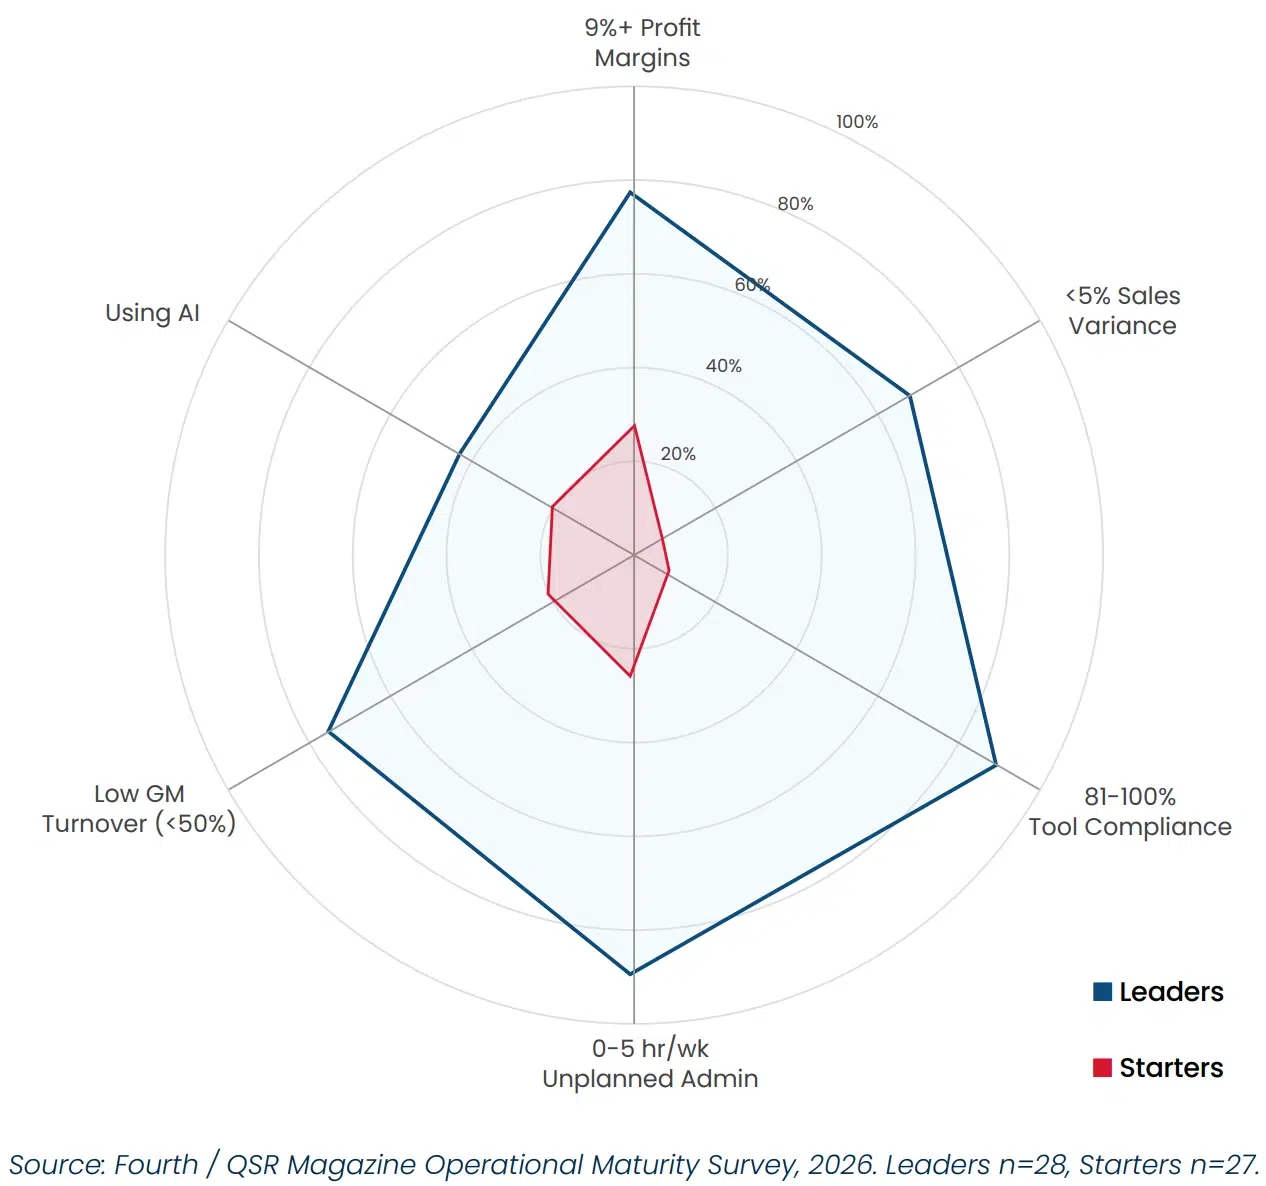
The AI & Automation Divide
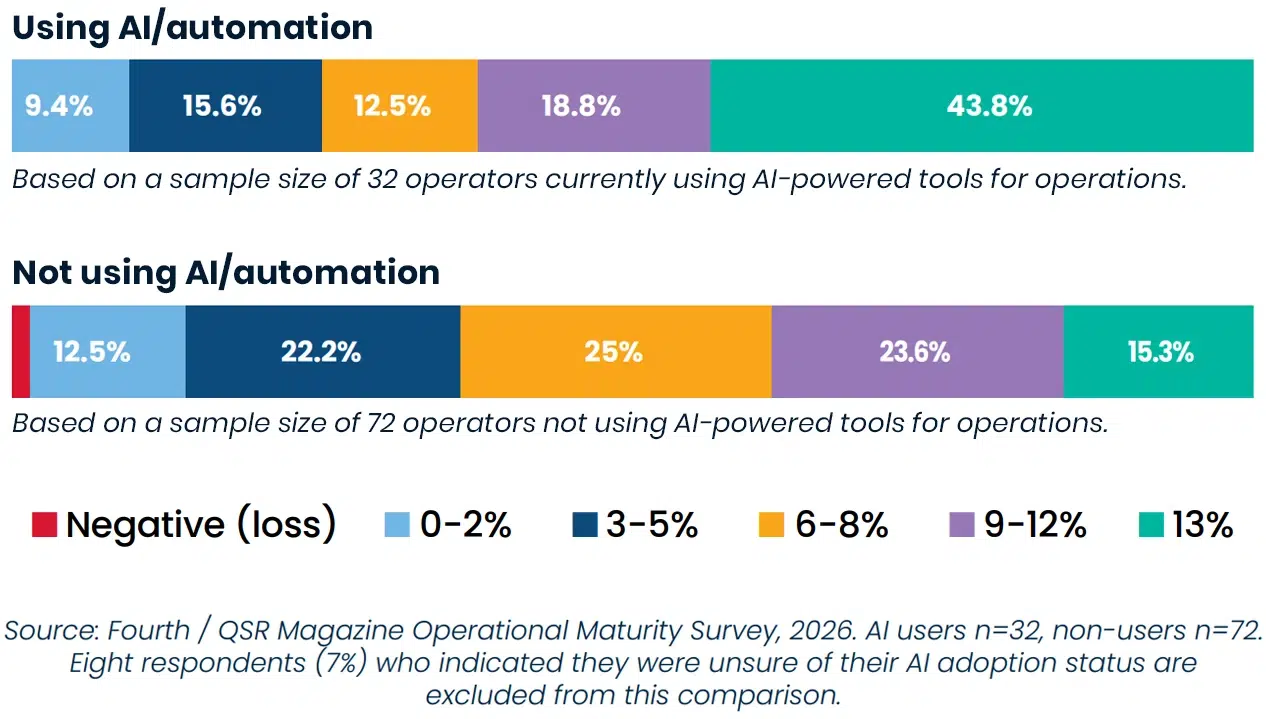
The bottom line: AI amplifies the advantage for operators who already have strong operational foundations. Without consistent tool discipline across locations, technology investments underperform.
Profit Margins: AI Adopters vs. Non-Adopters
How do your four pillars stack up?
See Where You Stand
Take the Operational Maturity Scorecard to benchmark your brand across the four pillars and get personalized results in minutes.
Free · No login required · Results in under 5 minutes
About This Research
The State of Restaurant Operations 2026 is a benchmark survey of 100+ restaurant leaders conducted in partnership with QSR Magazine and WTWH Media. Respondents include C-suite executives, directors, and owners across brands ranging from single-unit operators to 500+ location chains. Over half oversee 20 or more locations, and one third operate within brands managing 100 to 500+ restaurants.
The study was developed by Fourth, whose platform connects every part of a restaurant’s operation — people, product, and profit — into one AI-powered system spanning workforce management, inventory operations, and demand forecasting across thousands of locations.